Synergizing Data Analysis: Python’s Versatility in Databricks
Introduction
In this article, we’ll describe what DataBricks is and why we may want or need to use it.

Then, we’ll show that DataBricks can work, among the others, with Python. In particular, we’ll show how we can use the Notebooks that DataBricks provides us the exact way we use Jupyter Notebooks.
The use case we’ll implement at the end of this article, then, we’ll show how easy it is to use Python to make data analysis and predictions with Machine Learning using the Notebooks in DataBricks.
Introducing DataBricks
DataBricks is a Data Lakehouse Platform that “combines the best elements of data lakes and data warehouses to help you reduce costs and deliver on your data and AI initiatives faster.”
The concept of Data Lakehouse arose only recently (circa 2020) and goes beyond the concepts and structures of Data Warehouses and Data Lakes.
Let’s see how.
The concept and structure of Data Warehouses were born in the 1980s and it’s a model that gives us the possibility to have structured data – meaning text and numbers – in a structured environment – to simplify and clarify: a database that uses SQL.
In recent years – circa in 2010 -, considering the need to organize somehow unstructured data – meaning: audio, images, and so on – the architecture of Data Lakes was born. This gives us the possibility to store unstructured data in a unique place for further analysis.
One of the big disadvantages of Data Lakes is that to make BI reports we first need ETLs to structure the data. Meaning: we need to create one (or more!) Data Warehouse inside the Data Lake, then we can analyze the data and make BI reports.
A Data Lakehouse, instead, is a new system “that addresses the limitations of data lakes. A lakehouse is a new, open architecture that combines the best elements of data lakes and data warehouses”.
Simplifying, the key advantages of Data Lakehouses with respect to Data Lakes are:
- BI support. BI tools can be used directly from the source data.
- Data governance. They guarantee data integrity through data governance.
- Lower data storage costs. Lakehouses have generally lower storage costs than Lakes.
In a few words, DataBricks is:
“One platform for your data, consistently governed and available for all your analytics and AI”.
Getting Started with DataBricks
To start using DataBricks, we first need to create an account here. DataBricks is it is a paid service, but they provide you with a 14-day trial license.
If you have an account on a cloud service, like AWS or Azure, you can use it: this comes in handy if you have data stored in one of such services.
If you don’t have one, you don’t need to create it. After filling in the fields for the registration, in fact, you can specify that you don’t have an account on any of the services they list and they’ll manage to make you use their cloud service.
The registration process is easy and fast and, in a couple of minutes (maybe, less), you are in and you can start working with DataBricks. For example, you can launch a new notebook or import data from your local machine:
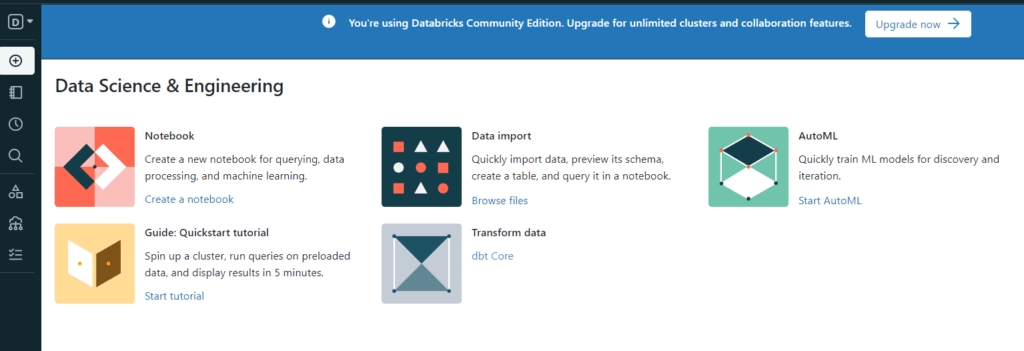
The very first thing we have to do is load some data in DataBricks before we can actually use it for our purposes. This process in DataBricks is called “cluster creation” because you’ll be assigned some computational resources. The process can be started by clicking on “Data” in the left sidebar:
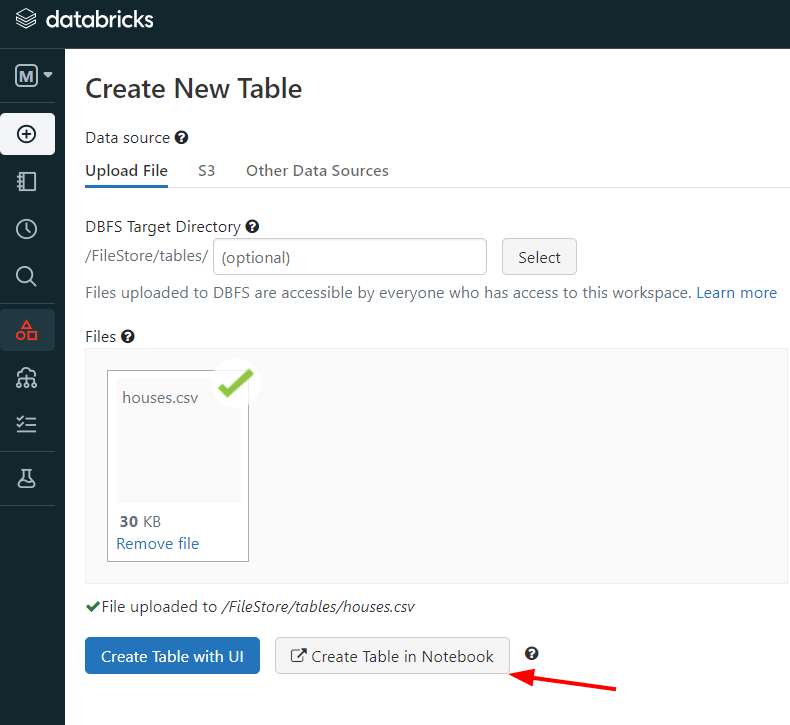
Now, here we can choose between three options:
- Upload a file. This makes us upload a file from our local machine.
- S3.This makes us retrieve the data from Amazon S3: Amazon’s scalable objects storage.
- Other Data Sources. Here you can choose between various sources, including Amazon Kinesis, Snowflakes, and others.
We’ll use a dataset to predict the pricing of houses retrieved from Kaggle here.
We simply download the file, unzip it, and load the CSV file into DataBricks:
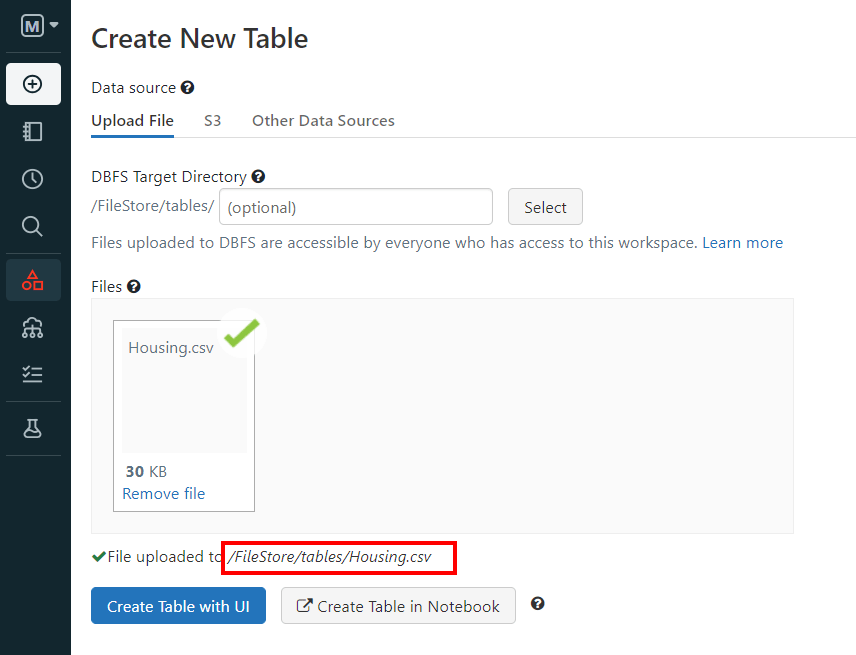
As we can see, DataBricks gives us a path that indicates the location of the file.
Python in DataBricks
Before starting our analyses, whether we’re talking about Machine Learning or analytical discovery, we have to create a new Notebook. We can do it from the dashboard like so:
As we can see, the Notebook is graphically similar to Jupyter Notebooks or Notebooks in Google Colaboratory.
If we want, we can see the resources we have available in our cluster. On the left-sidebar we click on “Compute” and this is what we can see:
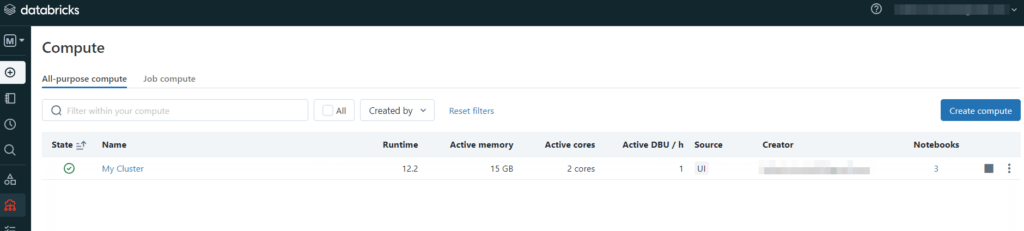
So, we have a cluster with 2 active cores and 15Gb.
Now, let’s return to our Notebook.
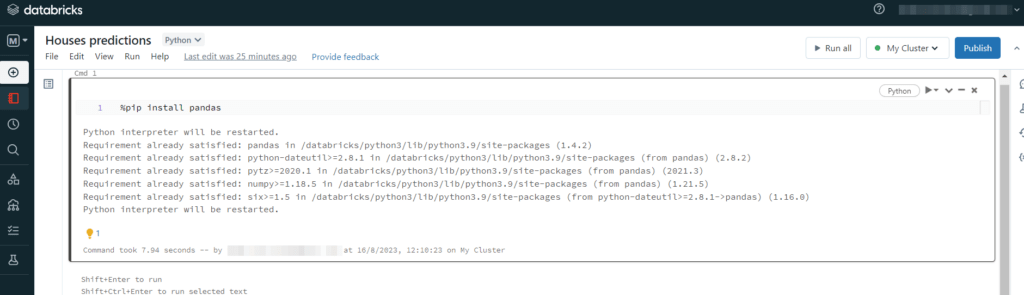
To install a Python library we need to use the magic command “%”.
The important thing to know is that DataBricks is equipped with all the most used Python libraries. So, for example, if we want to install Pandas by typing %pip install pandas, DataBricks will return to us that Pandas is already installed:
So, if we don’t need any particular library, we can import our data and show what’s inside it.
Now, DataBricks also helps us speed up the process involved in loading the data and analyzing it. What we mean is that DataBricks can directly create a new Notebook and add the data to our cluster when we import them.
So, suppose we want to analyze the data related to the houses, as we said before. This time the name of the file is houses.csv. We can perform the process by clicking on “Create a table in a Notebook”:
Then, DataBricks creates a Notebook for us that is ready to use:
So, DataBricks created a ready-to-use Notebook with the first cell written in Spark. This way, when we run it, it displays the data we loaded as we can see.
Analytics and Machine Learning with Python in DataBricks
Now, we want to make some predictions with Machine Learning using DataBricks.
For the sake of simplicity, we can use the “diabetes” dataset provided by sklearn.
So, let’s open a new Notebook in DataBricks as we’ve shown earlier, and import all the libraries we need:
import pandas as pd
import numpy as np
# Plotting
import seaborn as sns
import matplotlib.pyplot as plt
# Images dimensions
plt.figure(figsize=(10, 7))
# Sklearn
from sklearn.datasets import load_diabetes #importing data
from sklearn.linear_model import LinearRegression
from sklearn.model_selection import train_test_split
from sklearn import linear_model
from sklearn import metrics
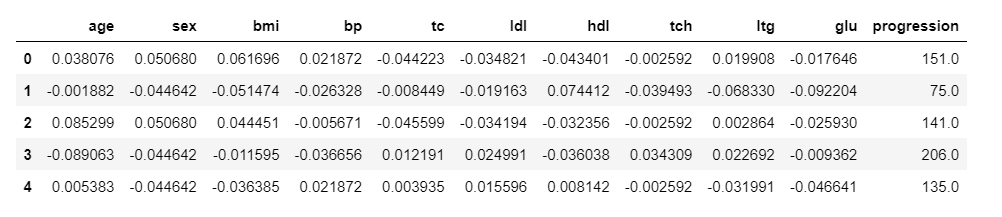
Now, let’s show the dataset:
# Import dataset
diab = load_diabetes()
# Definine feature and label
X = diab['data']
y = diab['target']
# Create dataframe from X
df = pd.DataFrame(X, columns=["age","sex","bmi","bp", "tc", "ldl", "hdl","tch", "ltg", "glu"])
# Add 'progression' from y
df['progression'] = diab['target']
# Show head
df.head()
Code language: PHP (php)And we get:
Now, first of all, let me tell you that I didn’t need to install any of the libraries imported above: they’re all installed in DataBricks.
Now, let’s see if there are any highly correlated features with a correlation matrix like so:
# Apply mask
mask = np.triu(np.ones_like(df.corr()))


# Show correlation matrix
dataplot = sns.heatmap(df.corr(), annot=True, fmt='.2f', mask=mask)Code language: PHP (php)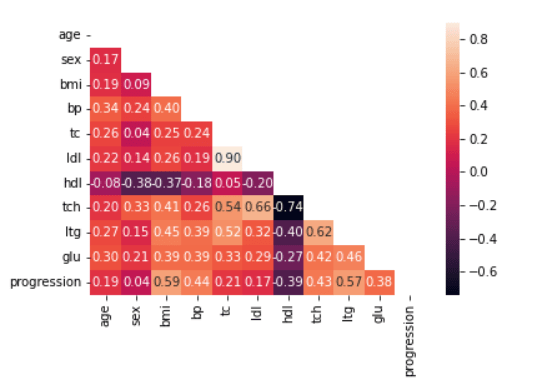
Now, let’s split the data into the train and the test sets, fit with a linear regression model, and calculate R2:
# Define features
X = df.iloc[:,:-1]


# Define label
y = df['progression']


# Split
X_train, X_test, y_train, y_test = train_test_split(X, y, test_size=0.2,random_state=42)


# Fit lin. regr. the model
reg = LinearRegression().fit(X_train, y_train)


# Make predictions
y_test_pred = reg.predict(X_test)
y_train_pred = reg.predict(X_train)


# R^2 on both sets
print(f'Coeff. of determination on train set:{reg.score(X_train, y_train): .2f}')
print(f'Coeff. of determination on test set:{reg.score(X_test, y_test): .2f}') Code language: PHP (php)
And we get:
Coeff. of determination on train set: 0.53
Coeff. of determination on test set: 0.45
Code language: JavaScript (javascript)
So, the results of R2 are not very convincing, and we’d try different Machine Learning models to solve this problem.
Anyway, here we’ve shown that a notebook in DataBricks can be used exactly as any other Notebook.
Conclusion
In this article, we’ve described the importance of DataBricks as a Lakehouse that, amongst the others, allows us to manage complicated ML workflows.
Anyway, we’ve also shown how to use Notebooks in DataBricks with Python. As we’ve seen, DataBricks has all the most used Python libraries already installed.
Also, we can use Notebooks in DataBricks the same we we use Jupyter Notebooks, but with the advantage to manage workflows and huge amounts of data, as well as unstructured data, depending on the actual problem we’re solving.
Concluding, some of the reasons why we may use DataBricks are when we need:
- To deal with large-scale data processing and analysis.
- A collaborative environment for data scientists, analysts, and engineers to work together.
- To build end-to-end machine learning pipelines.
- To analyze and process real-time data.
- To leverage the capabilities of Apache Spark without managing the underlying infrastructure.