Artificial intelligence is a true game-changer in many fields. But in healthcare, it promises to actually save and transform lives. Pacmed is a Dutch startup specialising in applying AI to healthcare, focusing on intensive care units. In his talk at Codemotion Amsterdam 2019, Data Scientist Michele Tonuti explained how they were able to create a scalable pipeline for finding features in complex healthcare data.
AI in the ICU
AI (or specifically machine learning) offers several potential benefits in an intensive care setting:
- ML models can be created to help support doctors making discharge decisions (is a patient well enough to be released?)
- AI can help doctors determine if someone can be safely extubated (that is, have the breathing tube removed from their throat)
- It can be used to allow ward managers to predict and control capacity in the ICU
- Finally, it can help predict when a patient may be at risk of complications by spotting patterns in their observations
Key to all these use cases is the ability to extract and identify features in the observation data from patients.
Finding features in complex data
In an ICU dozens of different observations are taken from each patient daily. These include physical observations (respirations, pulse rate, blood pressure, SPO2, etc.), but they also include laboratory test results. In addition, there are numerous standard pieces of data such as age, gender, medical conditions, allergies, etc. In total, there are maybe 100 or more observations, some taken as frequently as every 15 minutes. On top of that, there is also data relating to medication. To make things harder, every ICU has different approaches to how they measure data and even see different results for the exact same test.
In order to be able to do something useful with this huge dataset, Pacmed had to be able to extract features from it – so-called feature engineering. As an added twist, data protection laws mean that they have to be able to run their feature engineering pipeline on-site without access to the sort of super-computing cluster that is usually used for such jobs. In short, what they needed to create was a scalable, repeatable and efficient pipeline that can operate equally well on a cluster or on a laptop. Moreover, the results had to be easy for a doctor to interpret.
The key thing with many of these observations is that the instantaneous reading isn’t necessarily important. What matters is the trend over time. Typically, when presented with such a complex dataset, a data scientist will turn to one of several standard techniques to extract useful features from it. These standard techniques include:
- Deep learning, recurrent artificial neural networks and long short-term memory models (LSTMs).
- Fourier transforms, which are a classical way to extract information from signals that vary in time.
- Patient2Vec, described as “A Personalized Interpretable Deep Representation of the Longitudinal Electronic Health Record”
Pacmed explored all these techniques and found that none of them achieved what they needed, either because they didn’t scale, the data was too complex or there simply wasn’t enough data (in the case of deep learning). So, how to convert the complex, time-variable data into something that doctors can understand?
Simpler is better
Having rejected the typical complex data science techniques, Pacmed turned instead to more traditional statistical features. Things like max, min, mean, standard deviation, rate of change, etc. Importantly, they found that it was useful to look at these over multiple different time windows. For instance, the last day, the entire stay, the first day compared to the current.
In most ICUs, the raw data is available as a massive table of patient ID, time, observation type and observed value. When faced with such data, the first place to turn is the Python Pandas library. This is specifically designed to handle such tabular data using a Split-Apply-Combine paradigm to perform calculations:
Pandas is especially useful as it includes a grouper function. This allows grouping to be done in time windows:
So, isn’t Pandas ideal?
Pandas has many plus points that make it seem like the ideal solution for the problem:
- Easy to interpret, easy to use and reliable.
- Works well with time/date-time information.
- Offers a good selection of aggregations/statistical functions.
However, it has some negatives, particularly relating to scalability:
- No out-of-the-box parallelisation.
- Everything is stored and processed in memory.
- Custom aggregations are really heavy computationally.
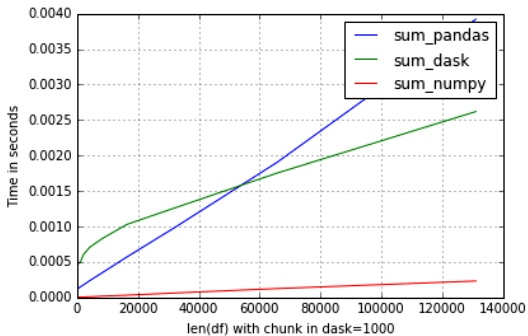
Fortunately, the DASK library makes it easy to parallelise Pandas (as well as numpy and scikit-learn). It allows you to scale up and work on large datasets that can’t fit in memory. It also lets you use standard Pandas operations (e.g. groupby, join and grouper) in distributed clusters. Equally, it makes it easy to scale-down to work on machines with limited resources (e.g. a laptop).
So, surely Dask/Pandas is perfect?
Unfortunately, no! There’s a few significant issues with Dask. Firstly, it doesn’t implement all the aggregations that are available in Pandas (e.g. it can’t apply custom functions on expanding time windows). Secondly, it has many parameters that have to be optimised such as number of workers, size of partition, etc. But it is extremely sensitive to these parameters. Changing one parameter slightly can dramatically affect performance. Finally, it is actually slower when you run it with smaller datasets.
TSFRESH – the perfect compromise
Fortunately, there is a (relatively) new library called TSFRESH (Time Series Feature Extraction based on Scalable Hypothesis testing). This library uses the same split-apply-combine logic as Pandas as well as the same data structures. But it uses numpy for all calculations. It also offers a huge list of aggregates out of the box, many of which are useful for time series data. It can scale down well, using multiprocessing. It can also scale up to cover clusters using Dask. Using this approach, Michele was able to analyse a dataset with 1650 columns and 2240 rows in just 1m26s using his MacBook.
However, TSFRESH is unable to deal with date-time features. As a result, the Pacmed team has created a custom fork. This uses the Pandas data frame when dealing with time-dependent aggregations, otherwise sticking with numpy vectors.
Conclusions
The important conclusion is that you should always try to find and adapt an existing solution. This can save you significant time and effort. Also, don’t be afraid to look at traditional statistical techniques. Machine learning is great, but only if you have enough data (a point Michele made in response to a question from the audience). Sadly, despite the wide range of observations collected for every patient, ICUs will never generate the millions of data points needed for deep learning to perform well.