Logging and monitoring make up a very important part of any “high-load” project nowadays. The goal of this article is to provide an overview of what can be achieved in order to organise efficient logging and tracing of modern web applications written on Java. A few tools configured to work together bringing great value to the project.
In modern web applications, especially if we talk about large enterprise projects, we can notice a very strong trend. It’s called microservices. More and more huge monolithic applications on the backend side are being split into multiple small, reliable and more maintainable parts – so-called microservices. Taking this approach isn’t an easy thing to do if you have to refactor a large project, but it pays off ultimately: it’s much easier to test, maintain, update and deploy separate small applications. That’s why this approach is conquering the world of backend today.

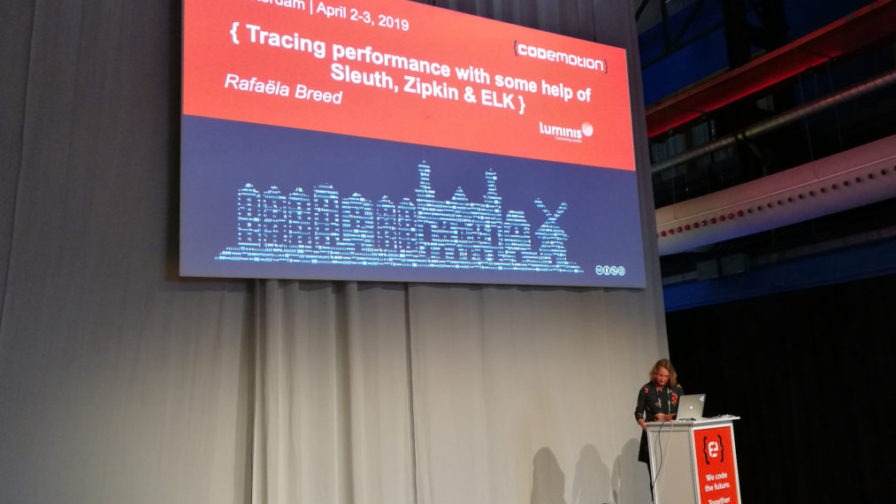
But with all those listed benefits, this way of designing applications also brings potential problems and challenges that we have to consider. They’re mostly related to the fact that the context of the whole application is spread across the microservices. Because of that, it can be more complicated to debug the application and find out where exactly errors appear. There is quite a common way to handle errors efficiently and check performance at the same time. It was the main topic of the talk “Tracing performance of your service calls with some help of Sleuth, Zipkin & ELK”, given by Rafaela Breed at Codemotion Amsterdam 2019.
To achieve clear visibility of what is going on in the whole application, working on multiple microservices, first of all, we need to find a way to trace every request going through the chain of these microservices communicating to each other. And here the first tool in the list can help us.
Sleuth
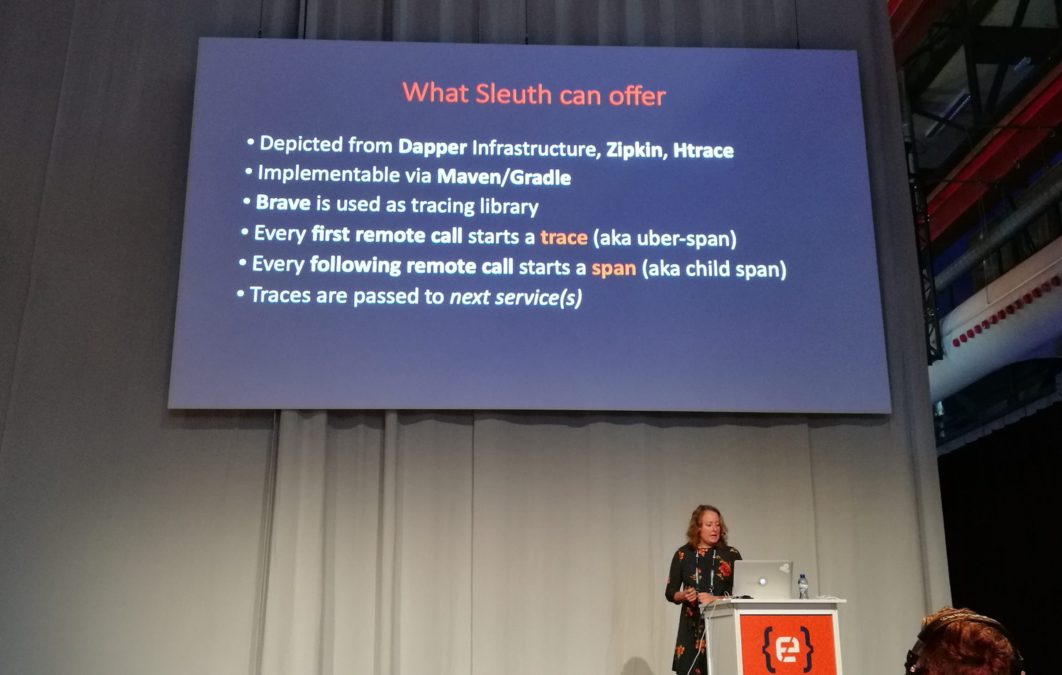
Sleuth is a part of Java’s Spring Cloud and it’s heavily inspired by such tools as Dapper, Zipkin, and HTrace. Two main responsibilities of Sleuth that we’re interested in are:
- It ensures that every request event initiated in a Spring application starts a new trace and creates a unique trace ID.
- It creates a span on every internal event, which also comes with a unique ID. It’s being destroyed once the event is finished.
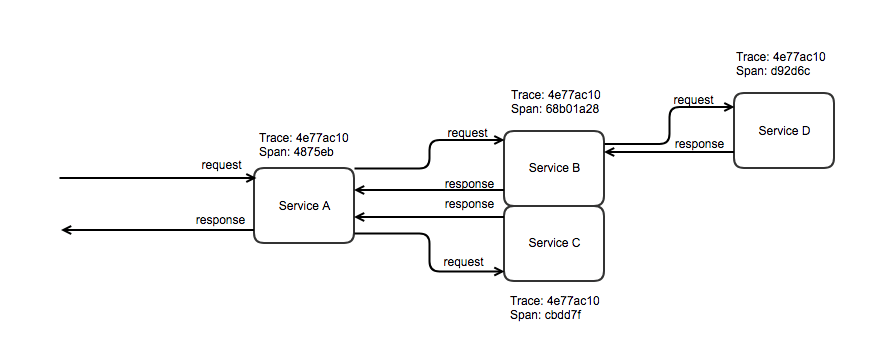
As you can see from the diagram above, trace ID stays the same across the whole flow of the application, but span IDs are different on each step.
So, let’s see how we can add Sleuth into a project. It’s actually pretty straightforward, we just need to add it as a new dependency. In the case where the project uses Maven as a dependency manager (Gradle is also supported), the code will look like this:
The easiest way of integrating Sleuth into a project will be its setup to all the microservices. In this case, none of the extra work is required because Sleuth will automatically pass the trace ID to the next service.
Once we’ve configured Sleuth in our application we can, let’s say, filter all logs by the trace ID and see only those related to the specific “session”. It’s already much better in terms of debugging, but we can go further. Here’s where Zipkin comes handy.
Zipkin
Zipkin is a “distributed tracing system” which consists of client and server parts. The server part is a Spring Boot application that receives information from the client part and displays it in a nice format. In other words, it’s a UI dashboard that can visualise the tracing data in a more useful way.
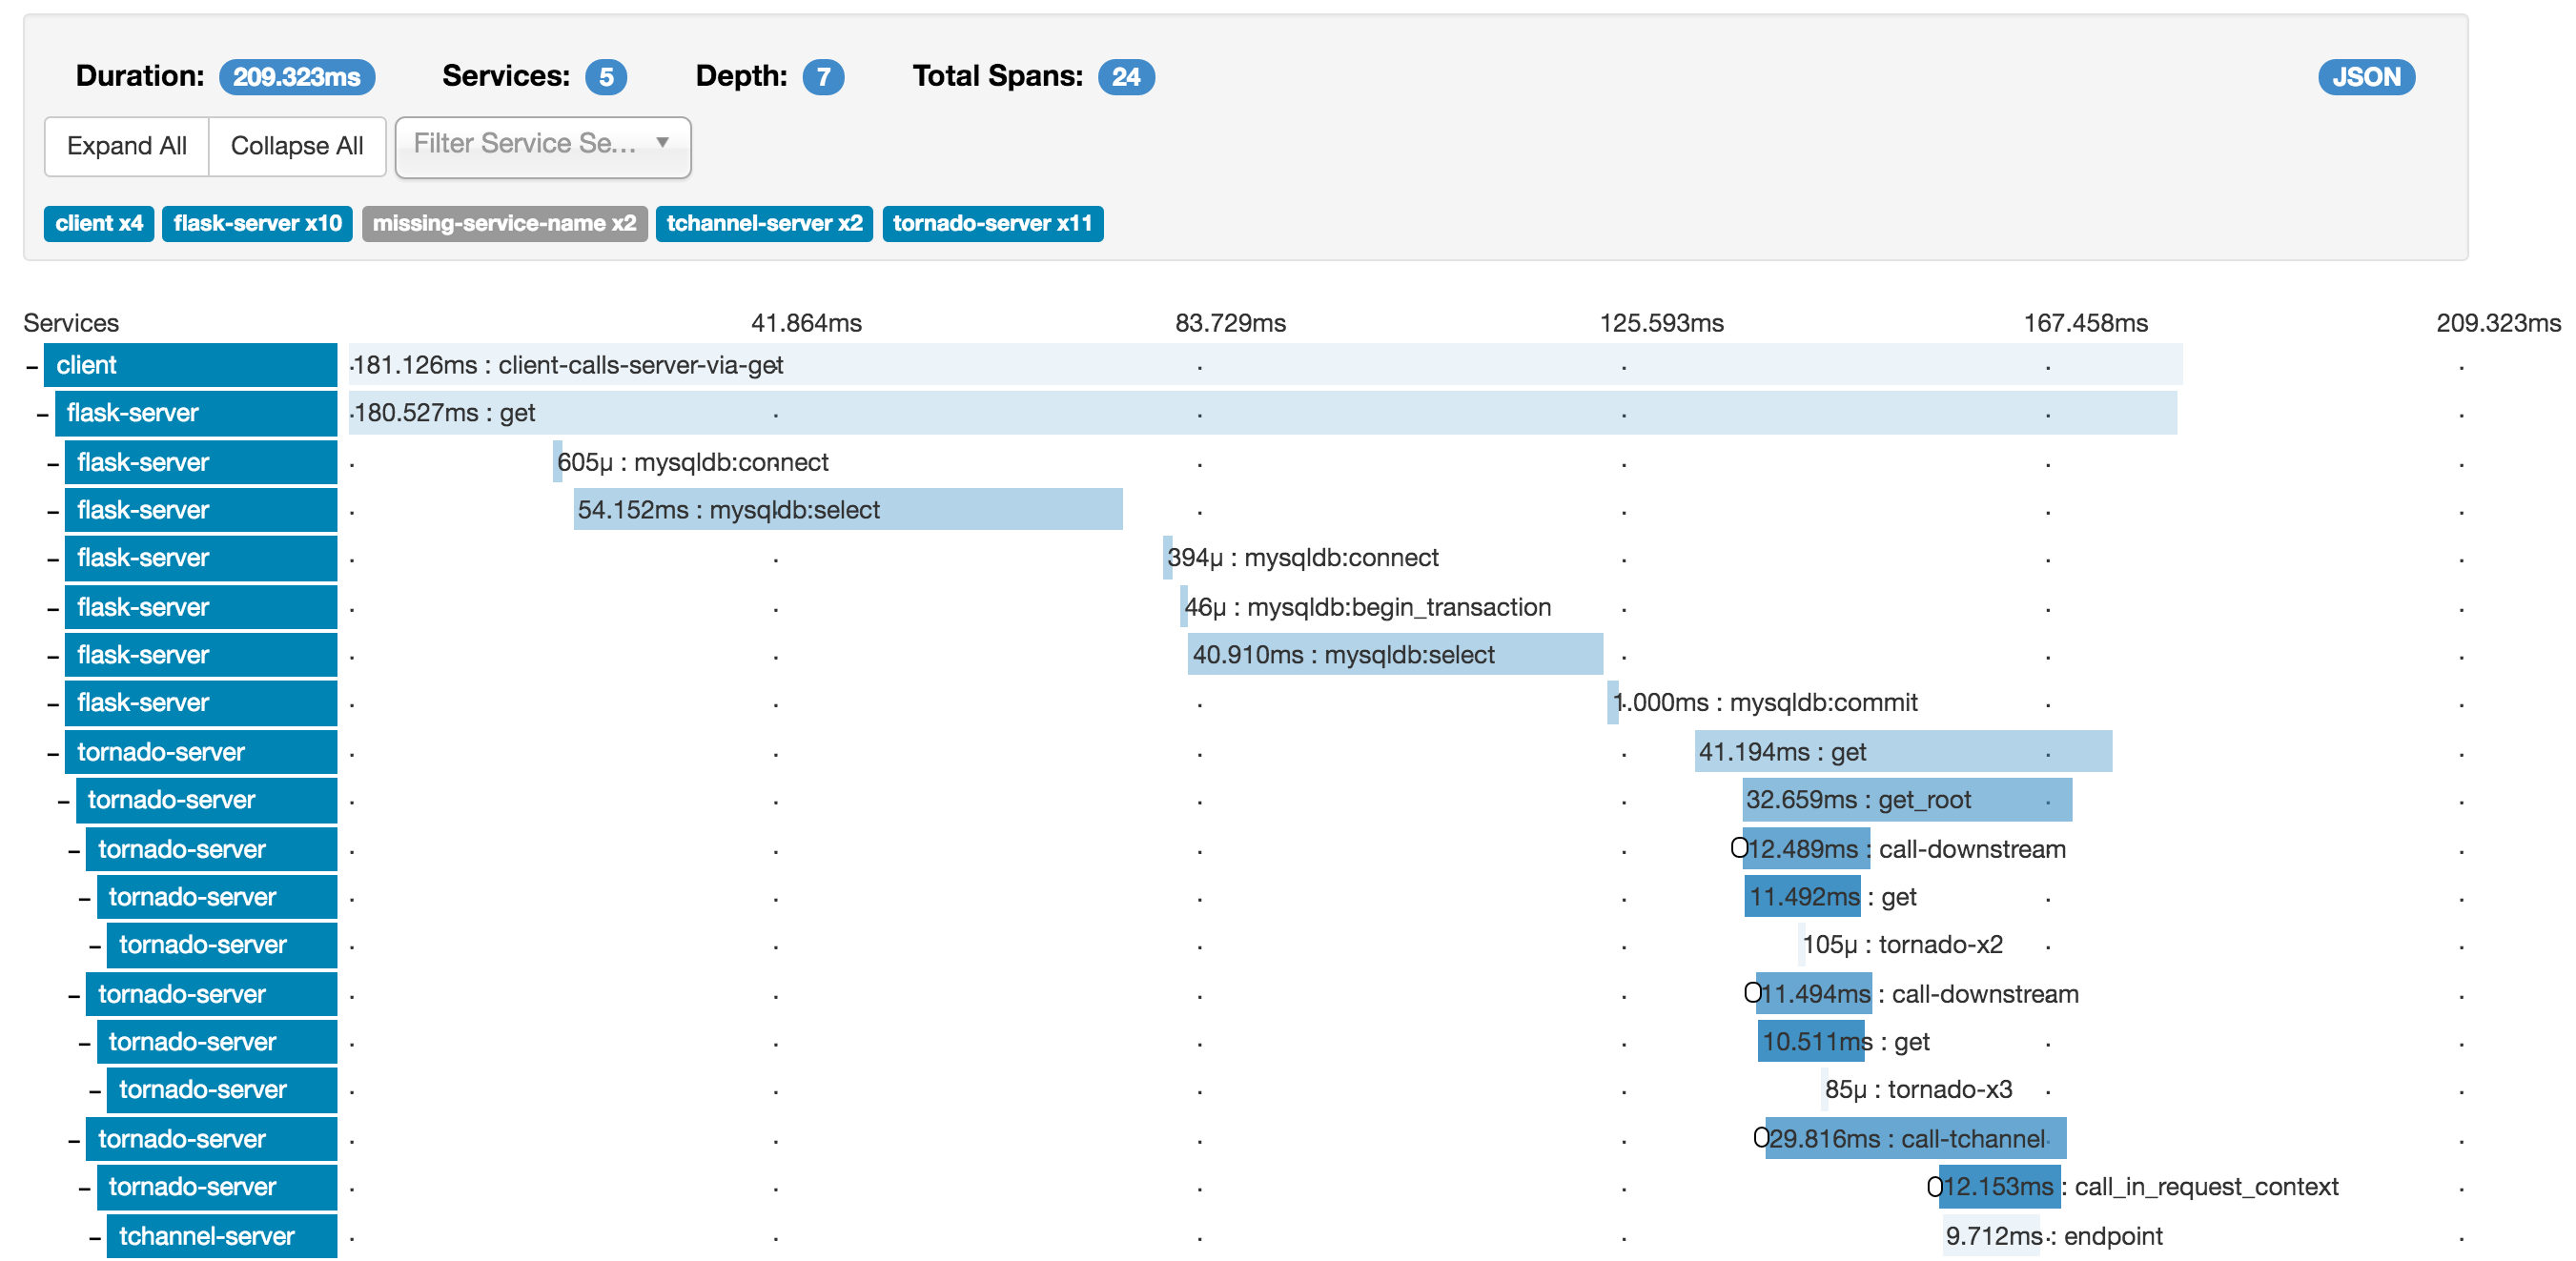
Look how easy it is to observe the application’s flow in this representation. We can immediately see which service is slow and where are the bottlenecks.
The quickest way to get started with Zipkin server is to run it from the official Docker image. This image can be running locally, default URL is going to be http://localhost:9411/zipkin
Zipkin client is integrating into a project as a dependency, in the same way as Sleuth:
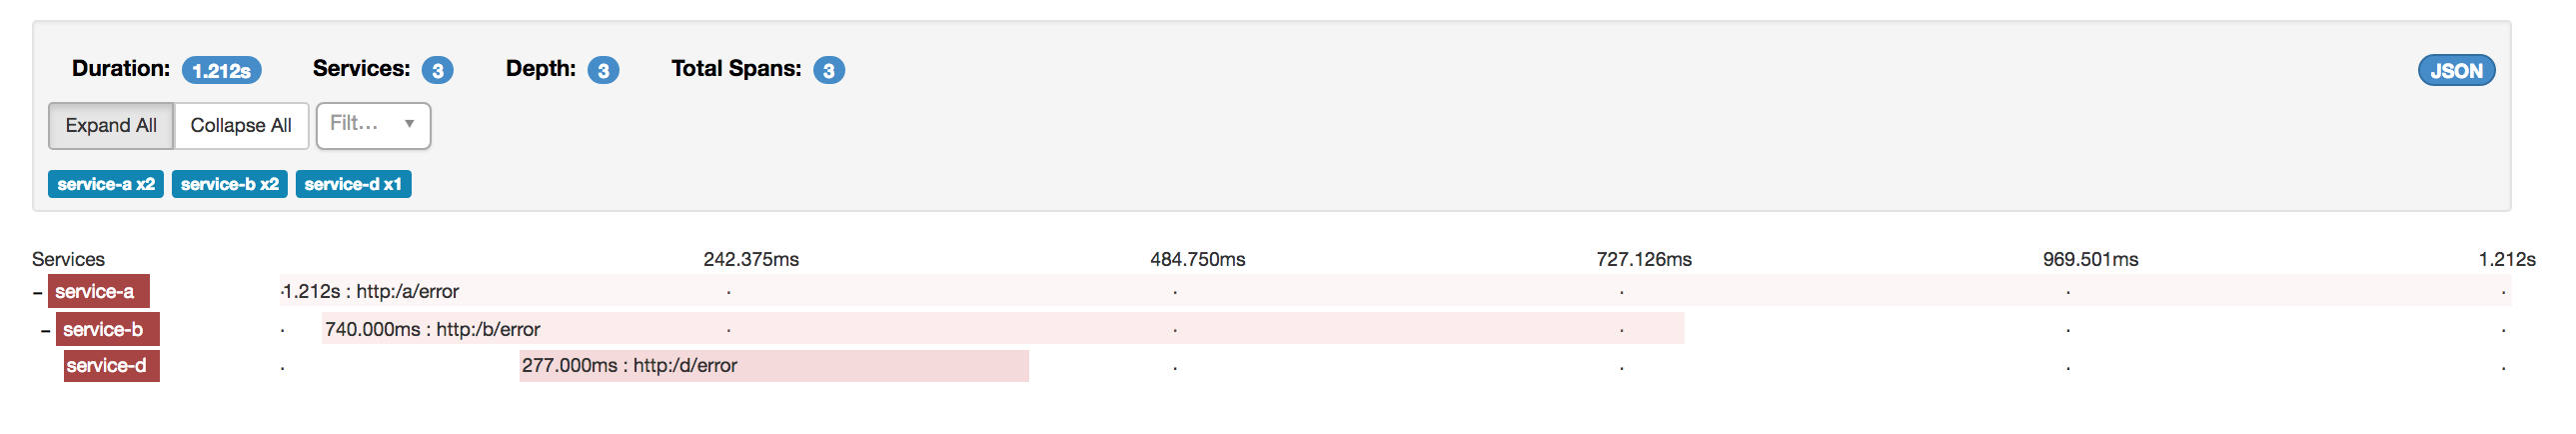
On the preview above we can see an example of happy flow. There are no errors and all the services are coloured blue. In case of errors, the services and spans become red. If you click on the spans you will get a popup window with the extra information. It might be helpful to filter all logs by the selected span.
It’s also important to mention that Zipkin by default is configured in a way that it logs only one of ten requests. It’s done with ProbabilityBasedSampler and controlled with the setting spring.sleuth.sampler.probability.
ELK
Last but not least, it is worth mentioning the ELK stack. ELK stands for Elasticsearch, Logstash, and Kibana. They are all products of the company Elastic, very often used together, forming this well-know stack.
- Elasticsearch. RESTful search and analytics engine which is also responsible for data storage.
- Logstash. Pipelines that are collecting, parsing and transforming all incoming data.
- Kibana. Web interface representing stored data. A place where you go to check logs.
Conclusion
Here is a quick overview of how you can monitor your application performance and what you can achieve with these tools. It’s mostly suitable for developers who create Java backend applications but the generic knowledge about logging and tracing can be extremely useful for every developer. Because logging and monitoring make a very important part of any “high-load” project nowadays.
Recommended article: Is it Always Best to Reduce Code Lines?