This article is an overview of GIS applied to the 3D field. GIS involves a lot of knowledge from different disciplines.
As developers we have a lot of ways to use and combine these data sources.
Sometimes I feel GIS is not so commonly known among developers. Let’s try to discover a bunch of interesting things about GIS. Hope you like it and get inspired for your next project.
Maps look like a 2D thing
We use maps everyday, but it’s not very often we see them in 3D. Why? Any of us could guess the following reasons:
- Navigation is the main use case. 2D is enough for this task.
- We don’t have enough 3D source data to work with.
- When we are dealing with 3D, we probably have to build a custom app in the same way as video games or movies.
- 3D is a fancy thing, just to make maps more beautiful
If you are a developer, you know those “reasons” are not accurate, but try to put on the average consumer’s shoes.
In fact, some developers still don’t know how powerful GIS is, and they think maps are a bunch of geolocated points. When you are dealing with geolocated data, you only have latitude and longitude or x and y, but what about elevation?
When is elevation important?
A visual example could be better for understanding the importance of elevation:
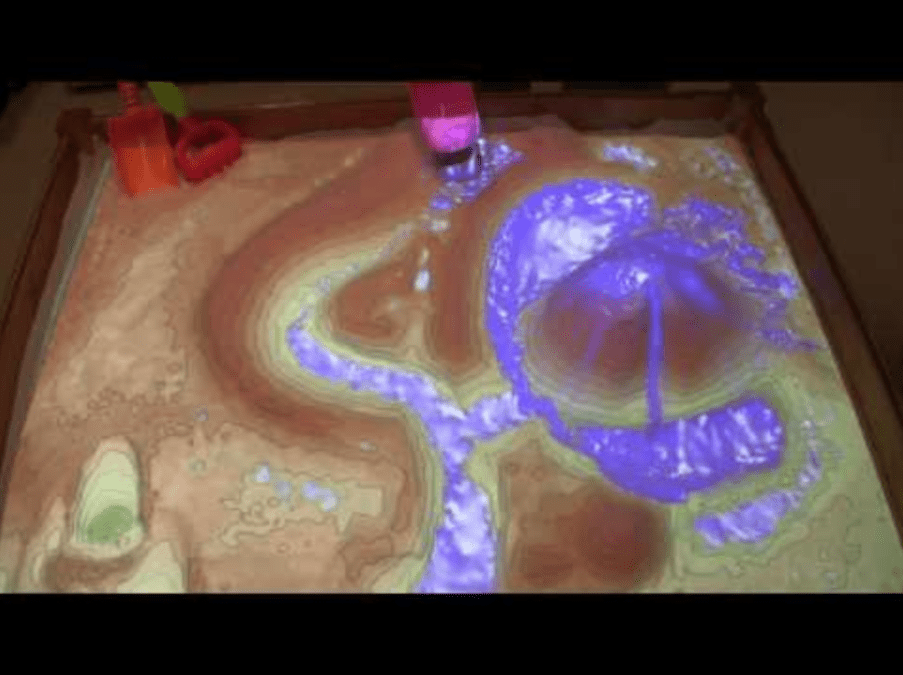
Img 1: Augmented reality sandbox with real-time water flow simulation
If you start thinking about when elevation information matters, you’ll realise there are a lot of use cases: construction, sea and river navigation, telcos… You can check some of them at this big list of GIS applications.
How 3D information is obtained, processed and used in maps
We’ve just seen how important elevation can be, so how can I get as a developer this information? Is it just another field in a geodatabase or a geolocated file? Is there any API that I could use?
In GIS jargon, when we talk about elevation, we often say DEM or Digital Elevation Model.
There are lots of terms and acronyms, depending on how the data is gathered, the data format and what the analysis is meant for. If you are interested in the differences, take a look at the following video:
As you can see in the video, there are several sensors and ways to get elevation information and different formats as well.
You can combine these different sources in a GIS workflow to build an Information model and consume it through SDKs or APIs, depending on which target is going to use it.
In the following picture, we can see a workflow from LiDAR point clouds captured by a drone to a Scene Layer (3D) that can be consumed and edited in a browser.
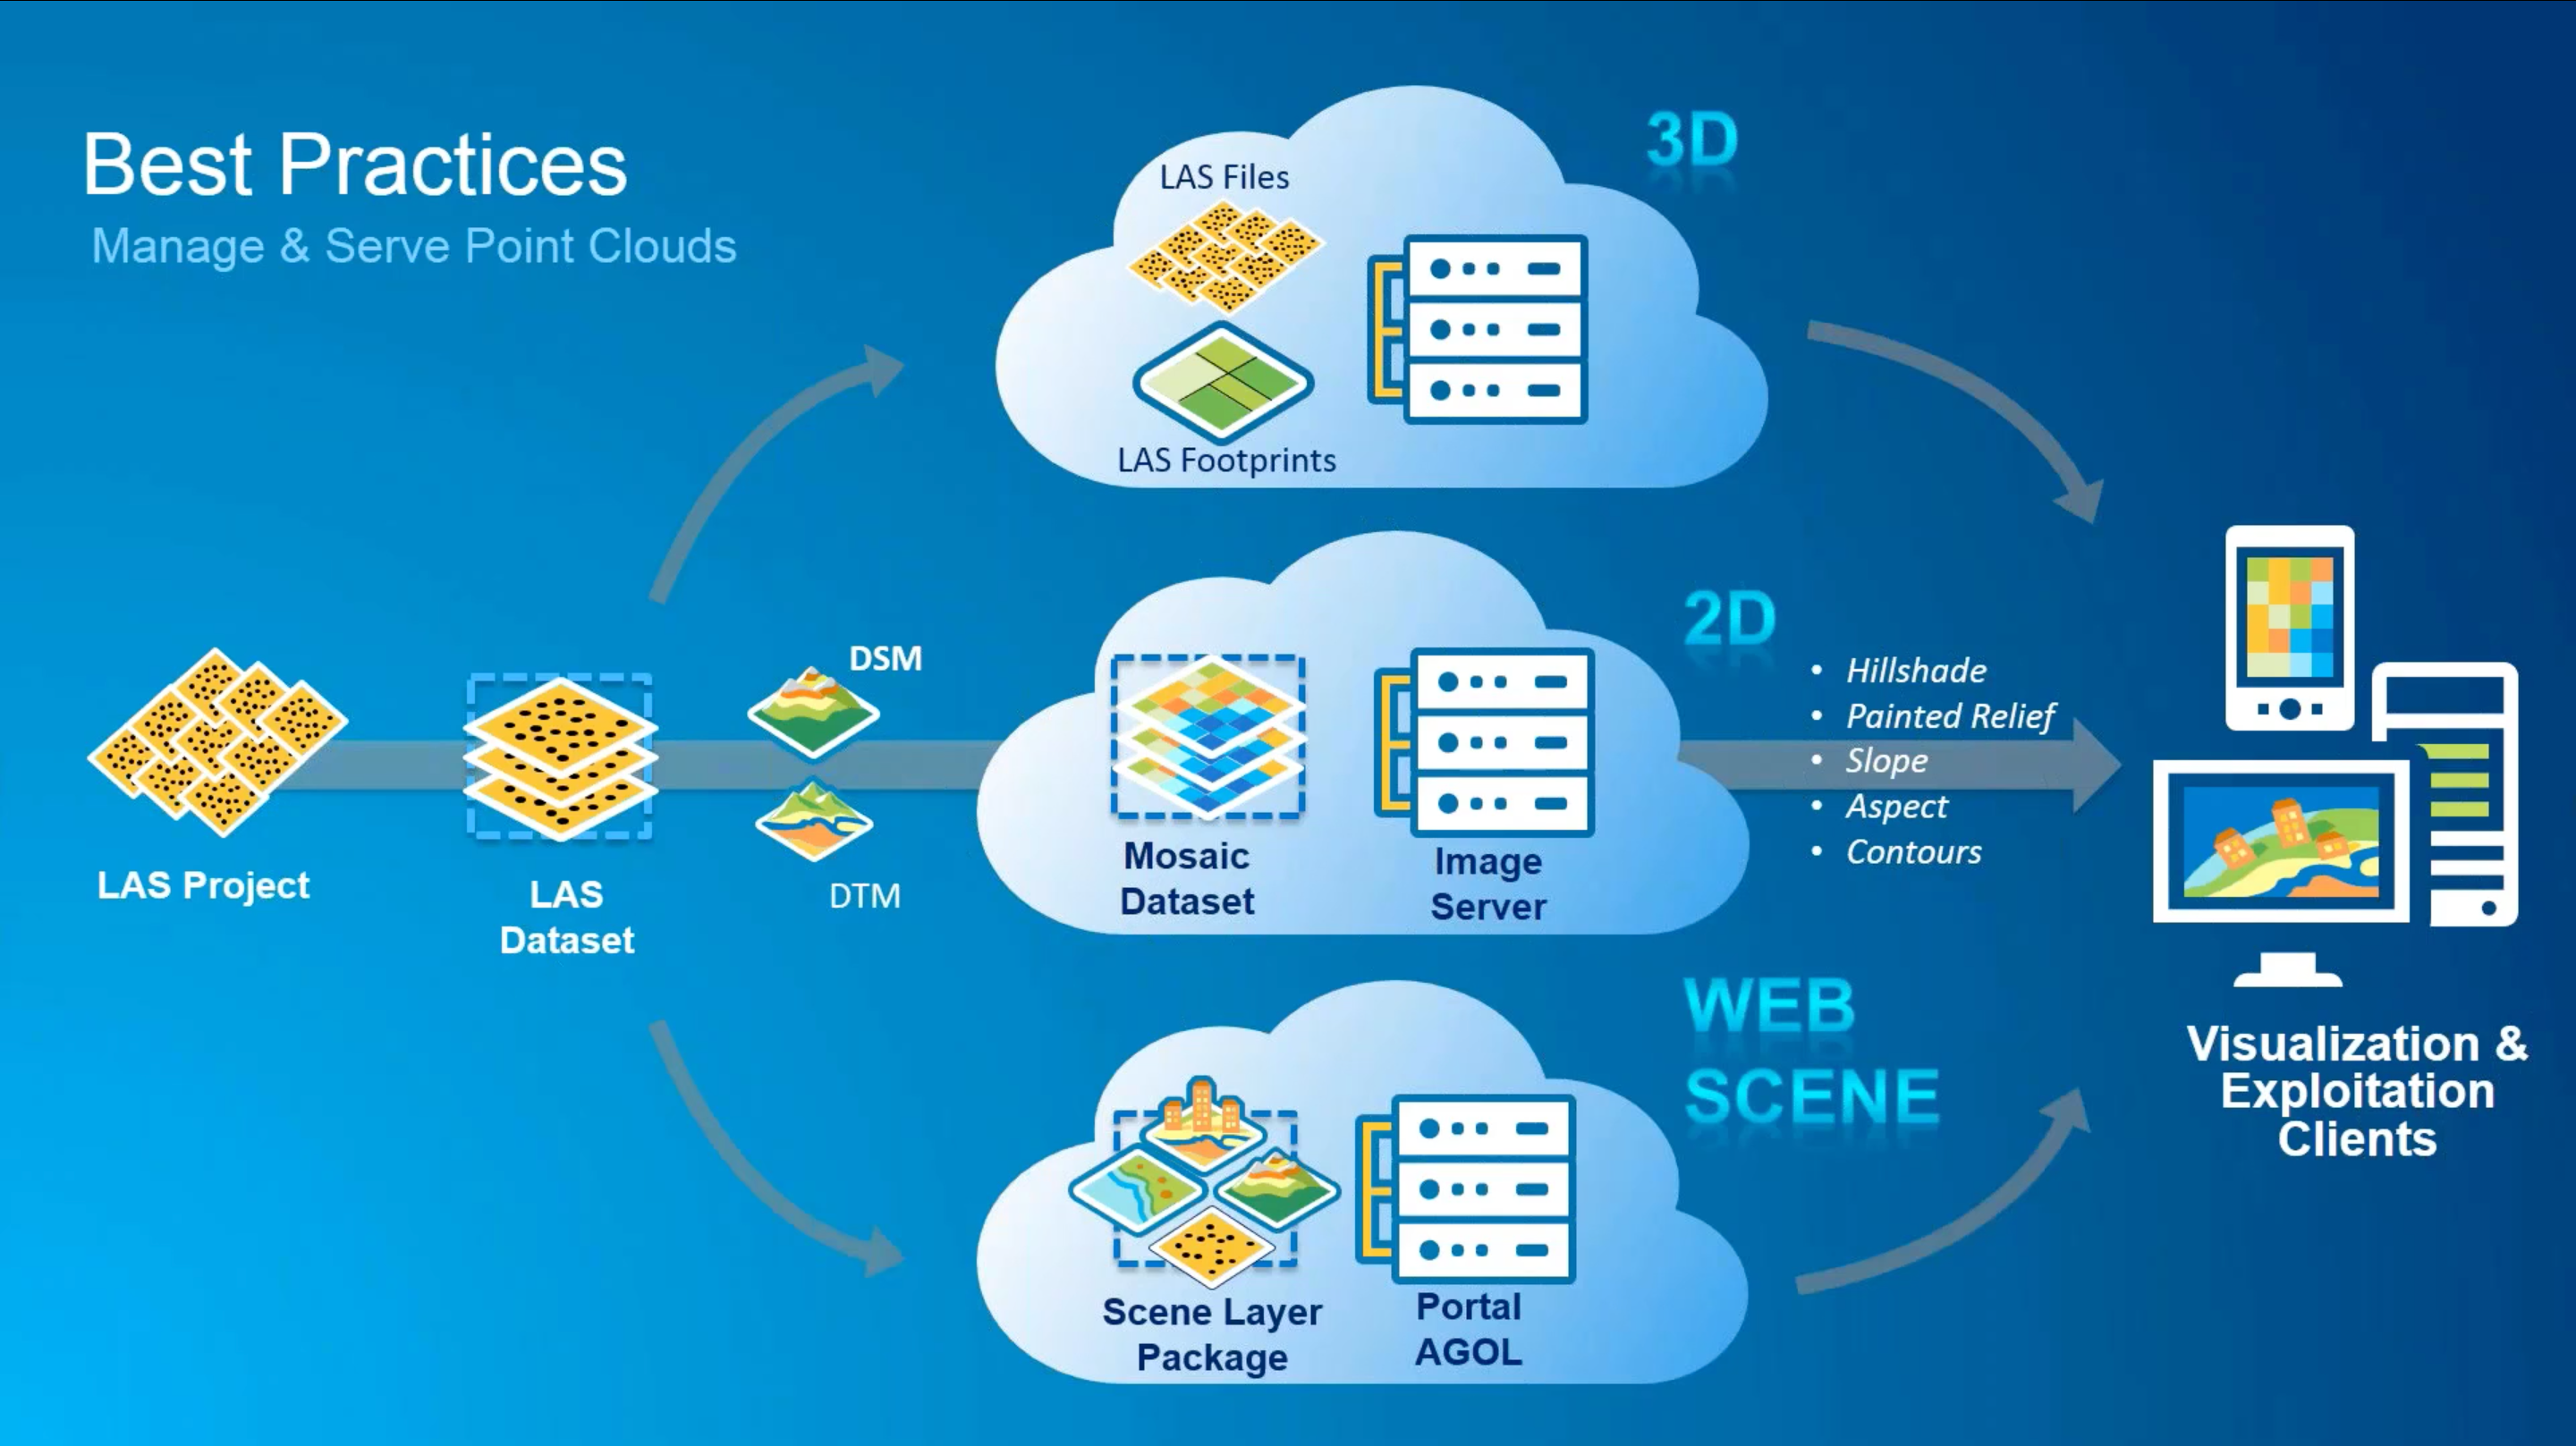
Img 2: GIS workflow with LAS files
If you want to see the whole process, from LAS files to a 3D scene, take a look at this demo.
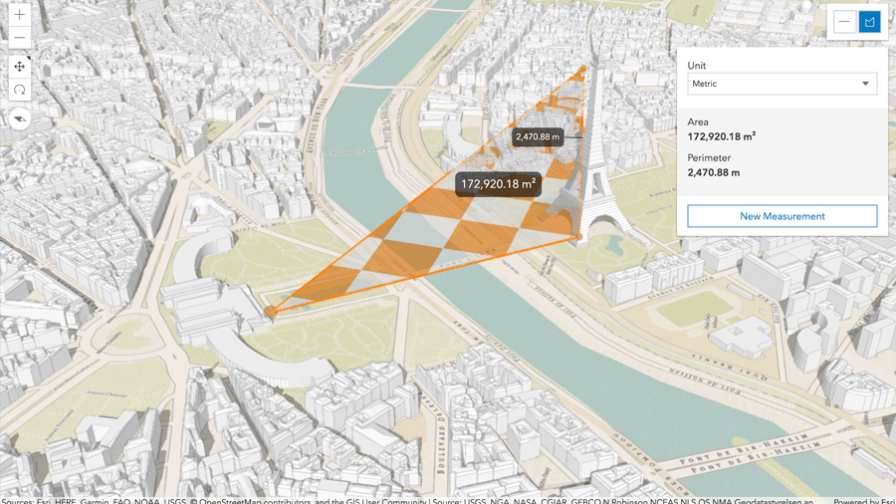
If you combine a DTS (Digital Terrain Service) with some open data of the buildings in Paris, you can easily build a 3D map and also can start to measure distances too! Check it out and play with it.

Img 3: Paris in 3D
Getting Elevation from services
We usually use APIs in our daily work as developers. So if you only want to know the elevation of a geographic point, you can use an elevation service which is just another REST API. Easy peasy!
For example:
See the Pen Query Elevation by ArcGIS JS API (@ntkog) on CodePen.
Elevation services offer more than the elevation value on several locations. They can perform visibility analysis (viewshed, line of sight), hydrology analysis like the downstream of a flow or use some prediction models for estimating risk of some floodings.
Imagine that you are a film-maker and you are planning to film some scenes. You want to place several cameras across an itinerary. GIS can help you to watch from any camera position. Take a look.
Look underground
You cannot see what’s underground on a flat map (2D). You basically have a basemap, but everybody knows there are a lot of things underground: water pipes, tubes, power grids, etc.
So how can we display those items? You know already: a 3D map!
Let’s see an example:
See the Pen Underground View Map by ArcGIS JS API (@ntkog) on CodePen.
Look through buildings
Finally, BIM (Building Information Model used in Architecture) and GIS are joining forces. The level of detail of buildings (furniture, windows, lamps, etc.) is combined with the geographic accuracy of the GIS.
Now we can build 3D maps of the buildings, getting access to any detail of the building or just filtering some assets of it. There are endless possibilities. Check it out!
See the Pen Building slice widget demo by ArcGIS JS API (@ntkog) on CodePen.