This article, developed together with Mònade, shares insight about data science and dives deep into the usage of Ruby on Rails for data visualization and processing through a practical example: Adalytics.

The human brain didn’t evolve to manage such vast, complex information, and it can be extremely difficult to grapple with raw data. Effective visualization is the key to making data actionable and competing successfully in every level of modern economic life. Ruby on Rails is an excellent tool for full stack development, but it’s also remarkably flexible. It can be used as a backend development solution to develop intuitive, reliable APIs with great results.
The Data Science Boom
One consequence of the information revolution is the creation of data science as a field and its rapid rise to prominence. While collecting data isn’t a new pursuit, it was once as simple as watching factory laborers at work and finding ways to streamline each process.
Data science impacts virtually every field of work today, from internal management and high-level strategy to advertising. However, few people are experts in collecting, analyzing, and even comprehending pure information. Data visualization is essentially the art of taking what is extremely complex and making it intuitive.
While this might seem like doing the same thing in a different way, it actually works wonders for efficiency thanks to the way the human brain processes information. As such, learning data visualization is a gateway to more effective operations at all levels of business and programming.
Why Should I Learn Data Visualization?
When marketing experts sell video content or recommend creating a company account on, say, TikTok, they invoke many statistics. Two of the most powerful examples are that 90% of the information the brain processes is visual, and that visual information processes 60,000 times faster than written information.

While a computer may absorb pure information faster than a human could imagine, that same person can comprehend it functionally just as quickly in a visual format. In practice, every individual data point has little importance, and the relevance of data lies in trends. With this in mind, the actual power of data visualization is even greater than the 60,000 times statistic as it immediately provides generalized, actionable trends.
This advantage is applicable to any enterprise that makes use of data. Marketers, business strategists, middle managers, developers, and anyone else benefit from effective visualization.
What Are the Most Popular Tools for Data Visualization?
While the techniques of data visualization are things such as pie charts and heatmaps, a tool is a software that developers use to visualize data. While it’s a somewhat basic example, Microsoft Excel already has these properties with the numerous types of charts and sheets that it offers. Likewise, Google Charts is a widely-used, accessible tool to visualize data.
More powerful tools for data visualization include Tableau, Zoho Analytics. These tools each have their own appeal, such as Tableau’s incredible scalability and ability to manage data from hundreds of sources. On the other hand, Zoho Analytics finds a broad niche by implementing tools that make it uniquely suited to presenting business data.
However, while the previous tools are great for non-devs, if you want to build a custom data visualization platform, there are plenty of tools a developer can use to visualize data, like ChartJS, Plotly, Highcharts, and many others.
This, in combination with a reactive framework like VueJS or React, allows developers to create a remarkably customized experience for users.
Besides the differences, popular data visualization tools tend to have much in common. As different techniques suit alternative types of data and operational goals, supporting numerous ways to present data is key. Scalability is also important, as systems need to efficiently handle large workloads and keep up with growth. This doesn’t just mean scalability with current needs but also resilience to projected future demands. Naturally, ease of use is also essential for any tool that seeks to simplify the complex.
Creating APIs That Simplify the Complex
Developing an API that presents complex information in a simple, intuitive way requires several steps. First, the original data must be reliable and applicable for the user. From here, the API needs to be able to draw data from these sources in a smooth, streamlined manner. The system needs to be flexible to suit the workflow and communication needs of your organization.
With these requirements in mind, it’s possible to build a suitable API to present complex, rich data more simply. However, there are also existing programs that provide developers with a purpose-built system for developing intuitive, visual systems for presenting data.
Using Ruby on Rails
Instead of reinventing the wheel, joining companies like Coinbase, Twitch, and Shopify by using Ruby on Rails is a decision worth considering. It’s a purpose-built, full-stack development framework that focuses on a programmer-friendly experience and an excellent final result.
Why Choose Ruby on Rails
Rails is a popular application for Ruby, thanks to the way it plays into the strengths of the language. In general, developers use Ruby to quickly create intuitive, sophisticated websites with a quality user experience. It offers a simple prototyping process that appeals to cash-strapped startups and big companies alike, as well as tools to facilitate many of the most common development projects today. Stock exchanges, eCommerce websites, SaaS services, and other programs that work with sophisticated, dynamic information thrive with RoR.

The root of Ruby on Rails’ ease of use and efficiency lay in its two underlying principles: Don’t Repeat Yourself (DRY) and Convention Over Configuration. DRY is a programming philosophy that minimizes redundancy to improve the consistency and integrity of code. On the other hand, Convention Over Configuration speaks to the fact that Rails comes pre-configured in a workable state and doesn’t require extensive configuration.
Ruby on Rails and data science
Rails, even if born as a monolithic framework, is split into many opt-in modules to handle very specific problems. This built-in module is also very extensible using a wide ecosystem of ruby gems.
There are a couple of them extremely useful for data science applications and to present this data as a REST API.
ActiveRecord / ActiveModel
These two modules are the ORM layer of Rails, supporting a vast array of SQL databases.
It can both handle the database creation and maintenance (through migrations), or connect to an existing schema, automatically detecting the table structure and creating automatic helper methods and query functions based on the SQL table.
Starting from a table definition like this:
CREATE TABLE `detections` (
  `id` int(11) NOT NULL AUTO_INCREMENT,
  `created_at` datetime NOT NULL,
  `temperature` int(11) NOT NULL,
  `country_code` VARCHAR(2) NOT NULL,
  `location` VARCHAR(255) NOT NULL,
)
Code language: JavaScript (javascript)
A minimal setup for a Model in Rails is achievable with just a few lines of code:
class Detection < ApplicationRecord
    # Rails automatically searches a table `detections`, based on the class name,
    # and dynamically defines every database column getter and setter
    # You can also remap the table name
    # self.table_name = 'my_custom_detection_table'
end
Code language: JavaScript (javascript)
You can now query the data in a very simple way:
Detection.where(country_code: ‘it’)
# generated query
# SELECT * FROM detections WHERE country_code: ‘it’
# output:
# [Detection(id: 1, country_code: ‘it’, temperature: 32.2, …), Detection(...), …]
Code language: PHP (php)
Active Record Scopes
Active record allows you to write queries and organize them in a very DRY way. Scopes are composable methods used to concatenate short fragments of queries together.
Here’s how to define a couple of scopes
class Detection < ApplicationRecord
    scope :order_by_date, -> { order(created_at: :desc) }
    scope :from_italy, -> { where(country_code: 'it') }
end
Code language: HTML, XML (xml)
The first is to ORDER the records by the column created_at
The second filters the records based on the country code.
You can compose them to create a query mixing the two conditions:
Detection.from_italy.order_by_dateCode language: CSS (css)Generated query:
SELECT * FROM detections WHERE country_code = 'it' ORDER BY created_at DESCCode language: JavaScript (javascript)The output of this call will be a list of Detection objects, one for every row returned by the database of the previous query.
Arel
Arel is a library embedded inside ActiveRecord. It’s a DSL to write SQL code in ruby, allowing to implement object-oriented logic around SQL queries, and composing/reusing part of code.
You can split and reuse parts of queries, or define custom methods wrapping SQL code, to improve the code reuse.
Here are some examples:
https://gist.github.com/ProGM/c6df08da14708dcc28b5ca325df37ceb
Arel can also be used to build queries for other SQL-compatible databases specific for big data (like Cassandra or Clickhouse) or time series data (like TimeseriesDB, QuestDB)
Gems
There are many great gems to enhance the developer experience. Here are a few examples:
- active_queryable or ransack gems are great to easily map API parameters to Model scopes
- Prophet is great for time series forecasting.
- rgeo helps to treat geographic data in ruby and maps that feature in the ORM
Wrapping up
Here’s a complete example of what you can do with ActiveRecord and Arel:
- We define a list of scopes, very granular, to wrap the most common filters we use with our data
- We define a wrapper scope that is used as a “view” for the frequently accessed data
class Detection < ApplicationRecord
    scope :from_date, ->(date) { where(arel_table[:created_at].gt(date)) }
    scope :of_last_semester, -> { from_date(6.months.ago) }
    scope :order_by_date, -> { order(created_at: :desc) }
    scope :group_by_house, -> { group(:location) }
    scope :from_italy, -> { where(country_code: 'it') }

     # We define a scope to get the current week given a date in SQL
    scope :week_column, -> { Arel::Nodes::NamedFunction.new('WEEK', [arel_table[:created_at]]) }
    # and here we use it
    scope :group_by_week, -> { group(week_column) }

    scope :select_location, -> { select(:location) }

    # Wrapping scope
    scope :weekly_report, lambda {
        from_italy
            .of_last_semester
            .group_by_location
            .select(:location)
            .select(week_column.as('week'))
            .select(arel_table[:temperature].avg.as('temperature_avg'))
            .select_avg
            .order_by_date
    }

endCode language: HTML, XML (xml)
And here’s a usage example:
Detection.weekly_reportCode language: CSS (css)And here’s the generated query:
SELECT `location`, WEEK(created_at) as week, AVG(`temperature`) as temperature_avg FROM detections WHERE created_at > 'xxxxx' GROUP BY location, WEEK(created_at) ORDER BY created_at DESCCode language: JavaScript (javascript)A Practical Example: ADAlytics
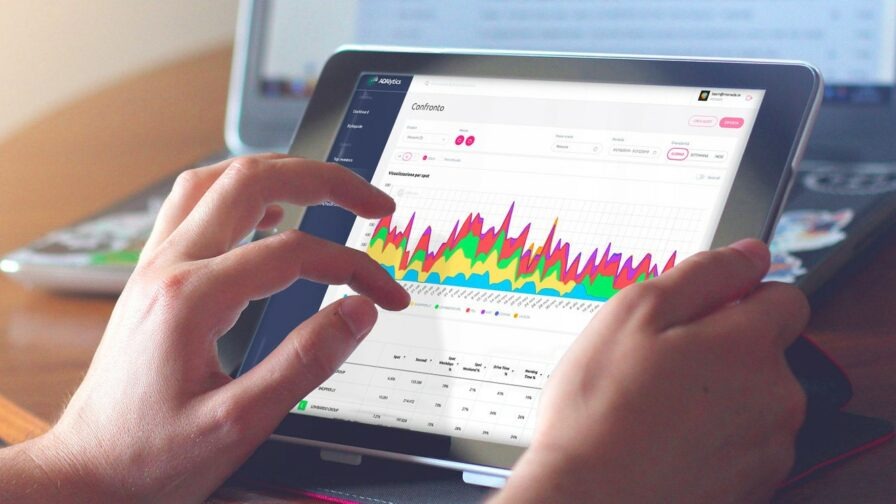
Adalytics, developed by Mònade, is an example of a tool built with Ruby on Rails and VueJS to visualize complex data in an easy way.
ADControl, the company behind Adalytics, had a great source of data that comes from tv and radio advertisements. They record 24/7 all tv and radio spots in Italy since 2014, and they collect and categorize them to have precise information on when a campaign starts, how many times a certain spot appears on a certain broadcaster, etc.
However, the architecture behind the service was based on a legacy MySQL database and they didn’t have a way to present the data to their customers.
Their challenge was to give their clients a platform to query and visualize this data in real-time, in an easy-to-understand and accessible way.
Adalytics was born as a custom analytics platform, like Google Analytics or App Annie, but specific for advertisers and companies that want to analyze their competitors, extracting, searching, creating custom charts and reports for this kind of data.
Key features:
- Display of customised and dynamic charts
- Dynamic selectors and filters for weeks/months, comparison groups and KPIs of interest
- Heatmaps on the most relevant KPI tables
- Real-time queries on advertising data
- Automatic speech detection on commercials, brand/keyword search
- Automatic alerts based on starting campaigns, keywords or named brands
- Possibility to listen and watch to spots
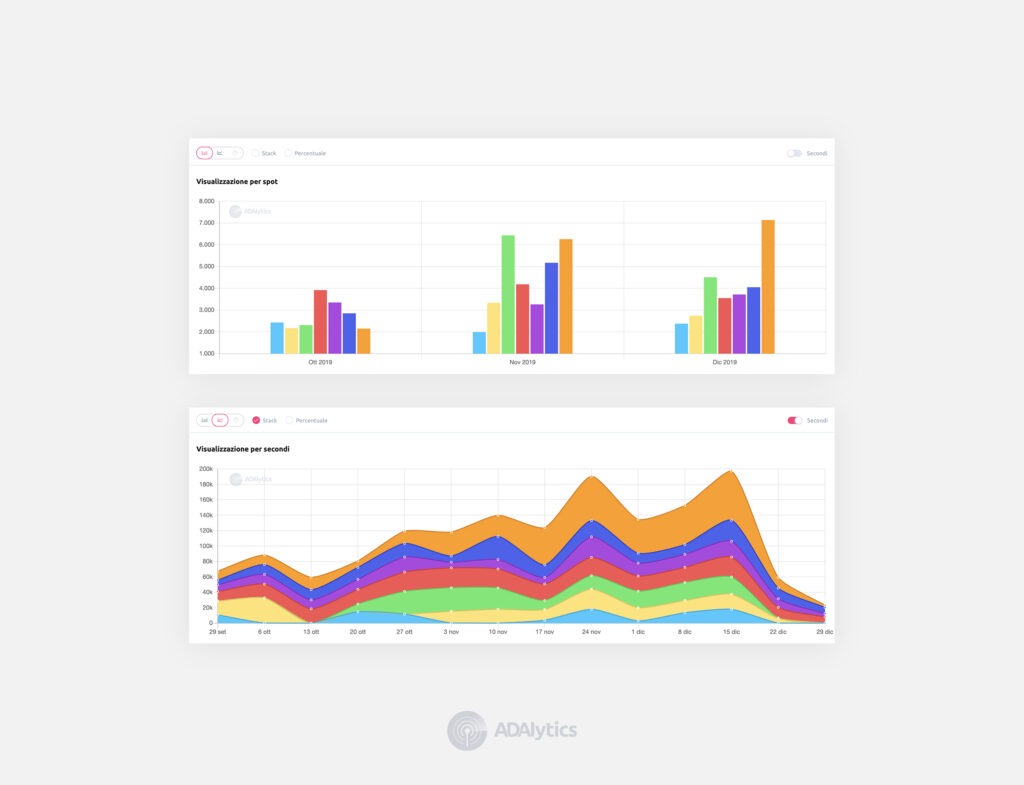
The flexibility of Rails and ActiveRecord was fundamental to creating an API responsive to their existing data, while integrating effortlessly with existing tables data structures.
VueJS in combination with ChartJS, instead, was the key to having a super lightweight frontend, but highly customizable by the customers.
Watch this interview to discover more about Mònade!


