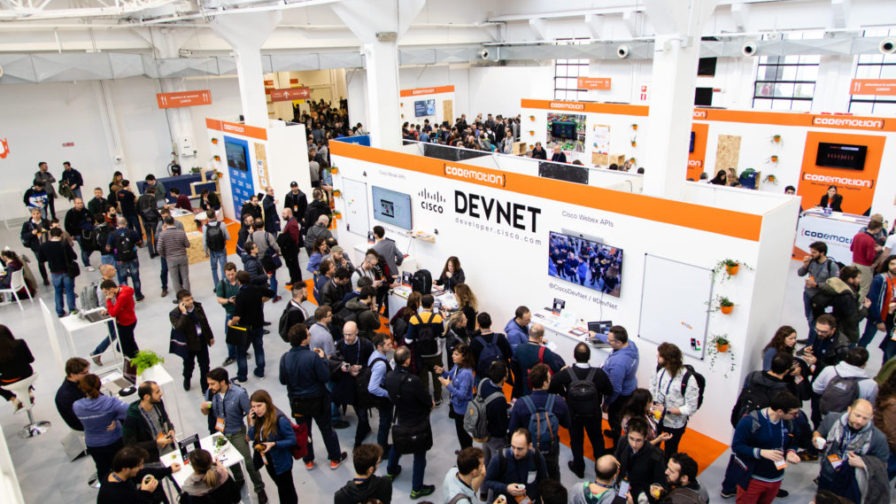
Before the COVID-19 emergency, Codemotion was in the process of organising its next big conference. The Call for Papers for Codemotion Rome 2020 closed with staggering numbers: 646 proposals submitted!
The conference was subsequently cancelled, but we can still benefit from the lost experience by having a look into those submissions.
If you want to know more about how modern technologies and tools can support you in the organisation of – and during – a virtual event, don’t miss this article showcasing the best of the tools we have used to host our online conferences since the COVID-19 outbreak.
Deep dive into the data: Companies
In the first two posts of the series I analysed only a portion of the Codemotion Rome 2020 data that was imported into Neo4J, with a particular focus on Communities from different angles. But the data ingested contains more information, such as the companies that the authors who submitted proposals work for. In this third post of the series, I’m going to explore the relationship that exists between these companies and the other entities in the data to see if interesting patterns emerge.
To warm up a bit, let’s start with something simple, like “which is the most active company?”
Let’s remind ourselves of the data model before implementing the query:
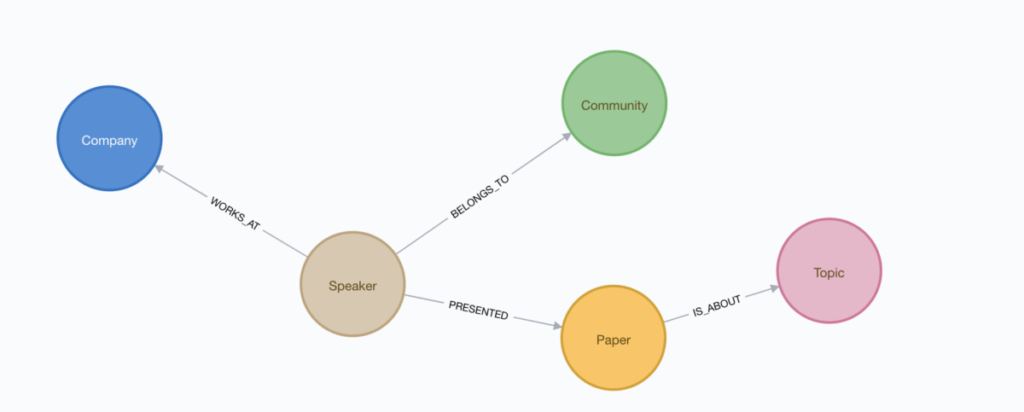
In order to elicit this first information we can reuse one of the queries I used in my previous posts to compute the degree of each company, based on the paths within the database:
// Paper presentati per compagnia
MATCH (company:Company)
WHERE NOT company.name = ""
WITH company, size((company)<-[:WORKS_AT]-()-[:PRESENTED]->(:Paper)) as degree
ORDER BY degree DESC
RETURN company.name, degreeCode language: PHP (php)
This displays the first five results, from which we can identify a clear winner:
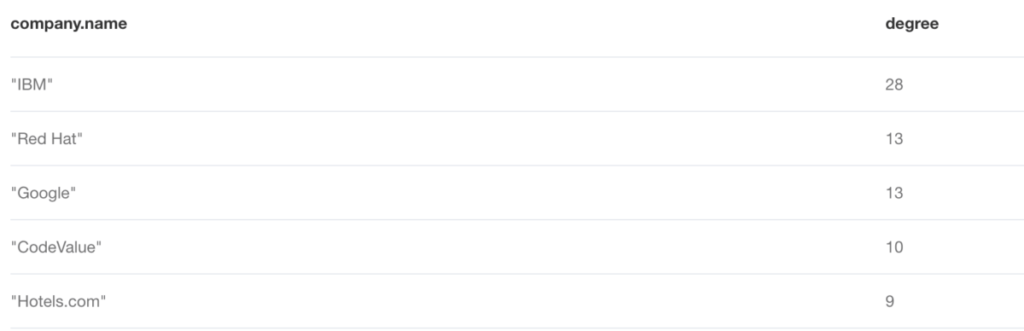
There are about twice as many submissions from IBM as there are from the companies in second place: all three companies are roughly the same size, in terms of employees, so that’s interesting to note.
Another interesting observation is that ‘CodeValue’ sits in third place, before Hotels.com. A much smaller company, compared to the rest of the other top-five companies (~200 employees according to LinkedIn), CodeValue nevertheless managed to submit a considerable number of talks to this conference edition.
What about the rest of the companies? How many submissions did they send?
Let’s use a visualization to give us an overview of the answer to this question:
// Companies -> Paper
MATCH (company)<-[:WORKS_AT]-()-[:PRESENTED]->(paper:Paper)
WHERE NOT company.name = ""
WITH company, paper, apoc.create.vRelationship(paper, "RELATED", {}, company) AS r1
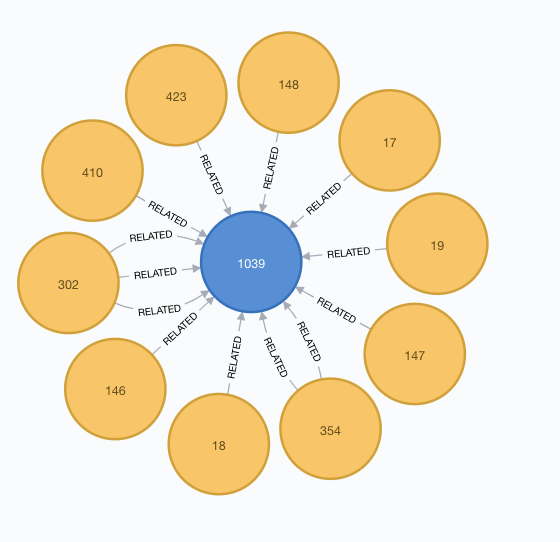
RETURN company, paper, r1Code language: PHP (php)In this case, I’m using the virtual relation APOC feature to draw a direct link between a paper (or submission) node and a company node:
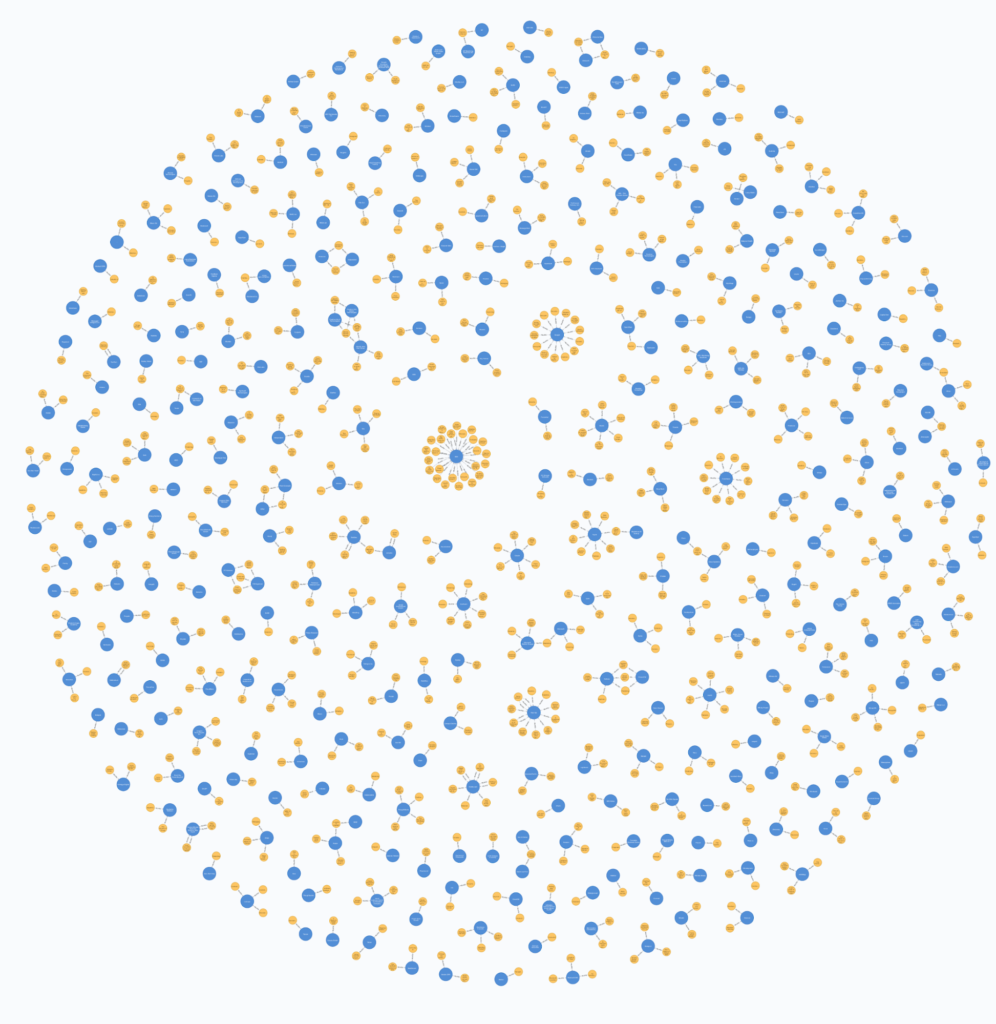
As expected, the IBM cluster is in the center, where multiple yellow nodes (‘Papers’/submissions) are connected to the blue node (companies):
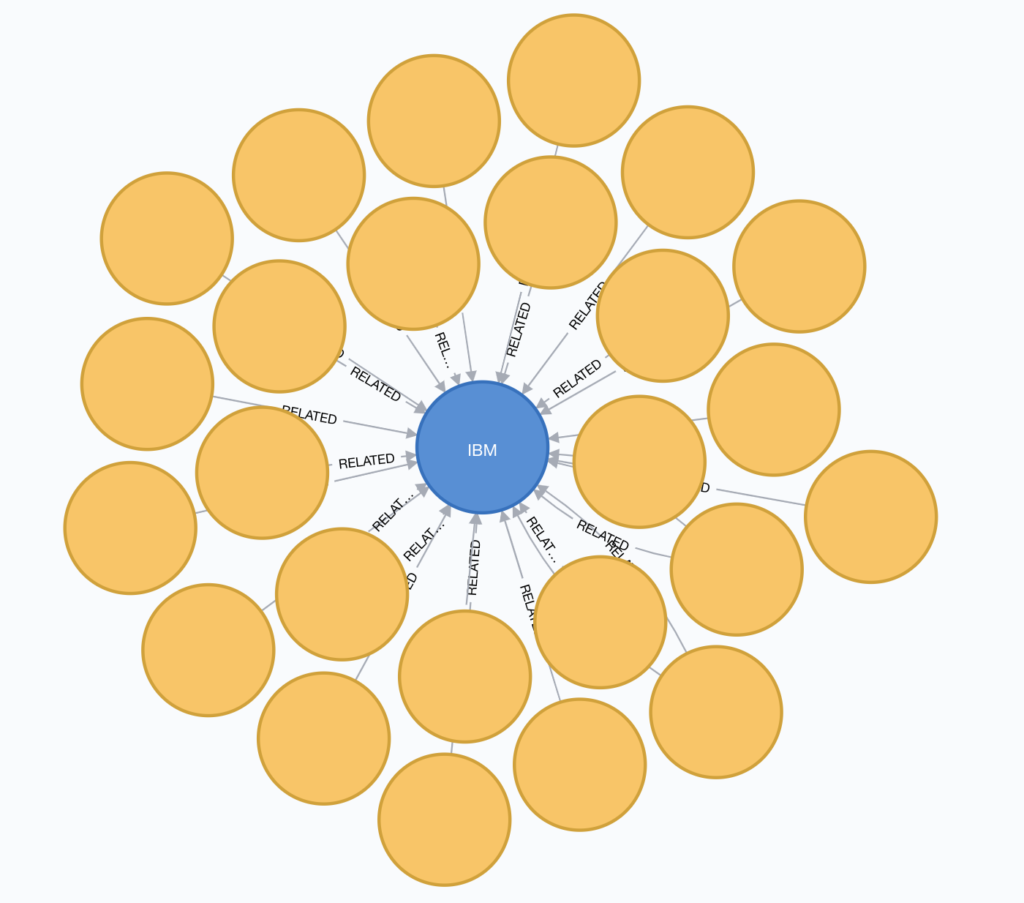
The other clusters shown are those in the first ranking result: RedHat, Google, CodeValue, Hotels.com, Toptal and so on…
The rest of the visualization most closely resembles a ‘snowstorm‘ plot – a bit like snow crystals on the screen, which probably indicates that each company generally submitted one or two talks.
Another interesting angle that this visualization offers is the opportunity to find talks with co-speakers from different companies.
A talk is usually delivered by a single person, but occasionally two or more people may want to present a particular topic. In this case the author can indicate a co-speaker or co-speakers on the submission form, and the co-speaker’s information is saved on the platform.
At this point two scenarios may occur; either the co-speaker is a colleague of the author (he/she belongs to the same company), or works for a different company.
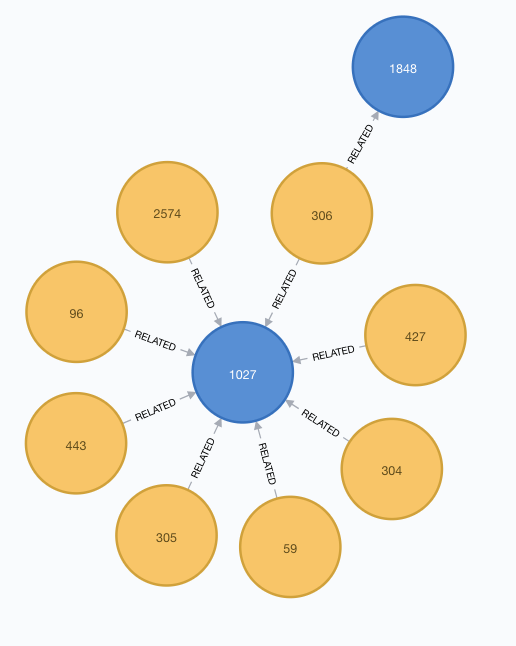
In the former scenario, the pattern in the visualization looks like the following:
In the alternative scenario, the pattern looks like this:
Of the 646 submissions, how many submissions included a co-speaker?
// Paper with co-speakers
MATCH (paper:Paper)
WHERE size((:Speaker)-[:PRESENTED]->(paper)) > 1
RETURN COUNT(paper)Code language: PHP (php)
There are 39 submissions with a co-speaker.
Of these, how many have co-speakers from different companies?
// Paper with co-speakers from different companies
MATCH (company:Company)<-[:WORKS_AT]-()-[:PRESENTED]->(paper:Paper),
     (company2:Company)<-[:WORKS_AT]-()-[:PRESENTED]->(paper)
WHERE NOT company.name = "" AND NOT company2.name = "" AND company <> company2
RETURN COUNT(DISTINCT paper)Code language: PHP (php)
Before presenting the result, it may be better to explain the query: in the MATCH clause I express two paths: one from a paper to a company, then from the same paper to another company (company2). In the WHERE clause, it is imposed that “company” (the first of the two) and “company2” are not the same node.
The result of the query is 25: therefore in 25 submissions there is more than one author, and the authors are from different companies.
Sometimes what looks like a real collaboration is just an artifact arising from dirty data, (i.e. a typo in the same company name). It’s a useful reminder to always clean up your data properly before running any analysis – be sure always to double check your data before jumping to conclusions!
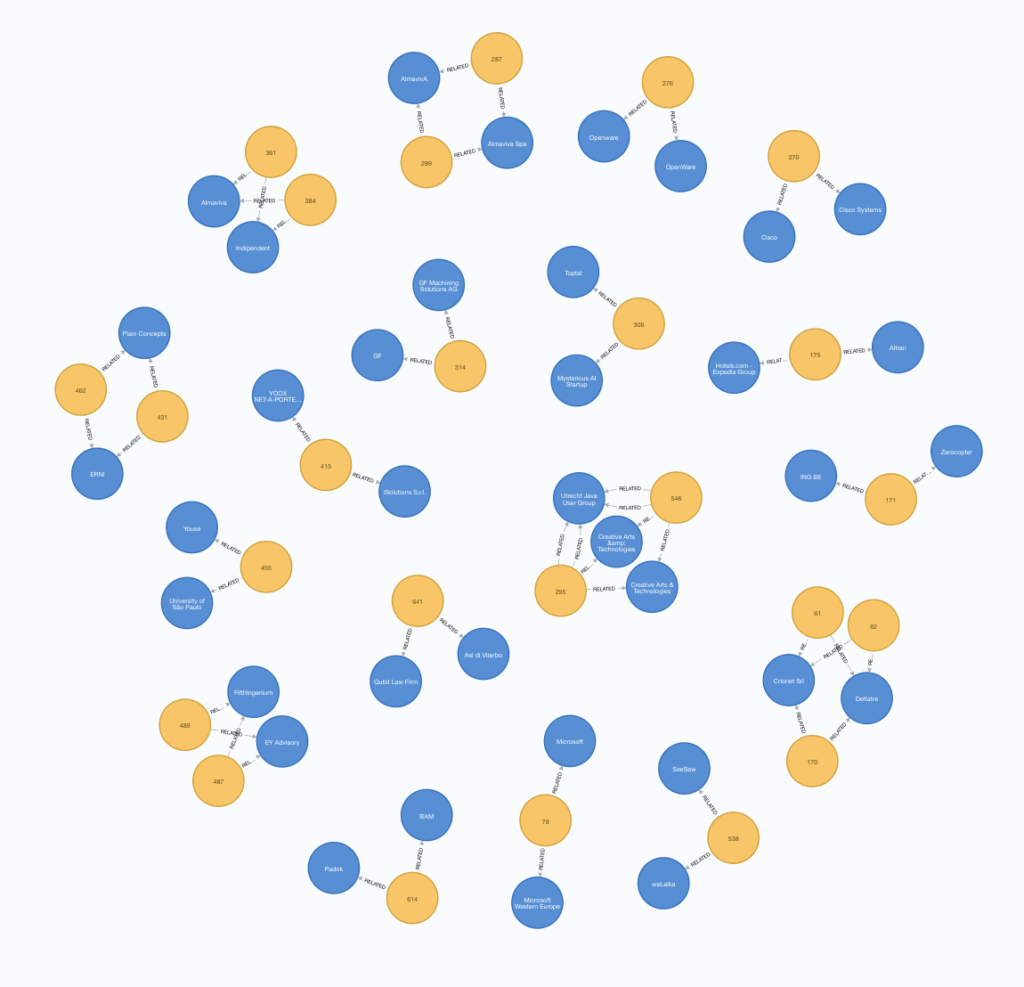
Visualizing the results can also help to spot these false scenarios, via either a network visualization or with a table. A visualization such as the one that follows can sometimes be much faster and more effective, compared to preparing the right shape of the table for printing.
// Paper co-speaker from different companies
MATCH (company:Company)<-[:WORKS_AT]-()-[:PRESENTED]->(paper:Paper),
     (company2:Company)<-[:WORKS_AT]-()-[:PRESENTED]->(paper)
WHERE NOT company.name = ""
 AND NOT company2.name = ""
 AND company <> company2
// this constraint is an implementation trick to avoid path duplicates
 AND id(company) < id(company2)
WITH company, paper, company2,
    apoc.create.vRelationship(paper, "RELATED", {}, company) AS r1,
    apoc.create.vRelationship(paper, "RELATED", {}, company2) AS r2
RETURN company, paper, r1, company2, r2Code language: PHP (php)
The query this time is a bit more complex than the previous one: when counting the submissions in the previous query statement it didn’t matter if there were duplicate paths, such as at the end when the returning results were filtered by a “COUNT( DISTINCT paper )” to takes care of this issue.
In this case, having duplicate paths means having a pair of ‘virtual Relationships’ for each pair of nodes, which will reduce the effectiveness of the visualization: imposing an artificial constraint on the company ID will pick only a single version for each path, thus returning the right result.
This is the main reason for data cleaning’s importance.
Codemotion Rome 2020: want to know more?
Do not miss the next post from the series, in which I will analyse how companies relate to communities.
In the meanwhile, if you are interested in Codemotion Rome 2020, do not miss the opportunity to attend: tickets are still available!